At RHI Magnesita, a global leader in refractories operating at 1200°C+, I led the end-to-end design of the Ladle Slag Model.
As the Product Designer I connected the gap between complex industrial automation and user-centric software to driving everything from initial stakeholder research and business logic to UI, branding, and go-to-market strategy.
Tools used: Figma, Miro, Illustrator, Photoshop, Azzure DevOps and Teams.
Timeline: 12 months.
Team: 12 people including me as a designer, 1 scrum master, 1 squad leader, 1 senior manager, 2 developers, 1 quality assurance, 1 lead architect, 1 technical marketing, 2 APO & AI Experts and 1 head of digital solutions.
Project management: Lean UX and Scrumban.
Countries applied: Austria and Brazil
Discovery
Value proposition
To ensure development efforts are properly focused, I establish a compelling value proposition that aligns business goals and provides a clear strategic roadmap for the product team.
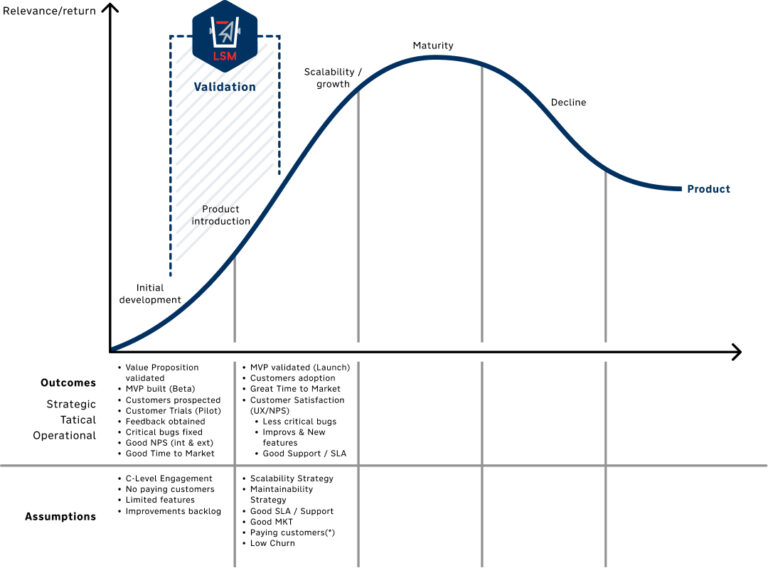
Product Life Cycle
We evaluated the product’s characteristics and successfully mapped its current stage to the validation phase. This clear understanding allowed us to immediately develop a targeted evolution strategy.
Stakeholders map
Working with a large volume of stakeholders requires clear strategy. By mapping the stakeholder landscape, we are able to efficiently prioritize communication and engagement based on the specific task being developed.
Work model
The IT team operates on an Agile-Hybrid System, which strategically blends the structured time-boxing of Scrum with the continuous flow management of Kanban.
This model uses short, iterative cycles, often called sprints or iterations, for planning and delivery, ensuring the team maintains a fixed rhythm and regularly delivers measurable increments of value.
Analysis
How the system operates
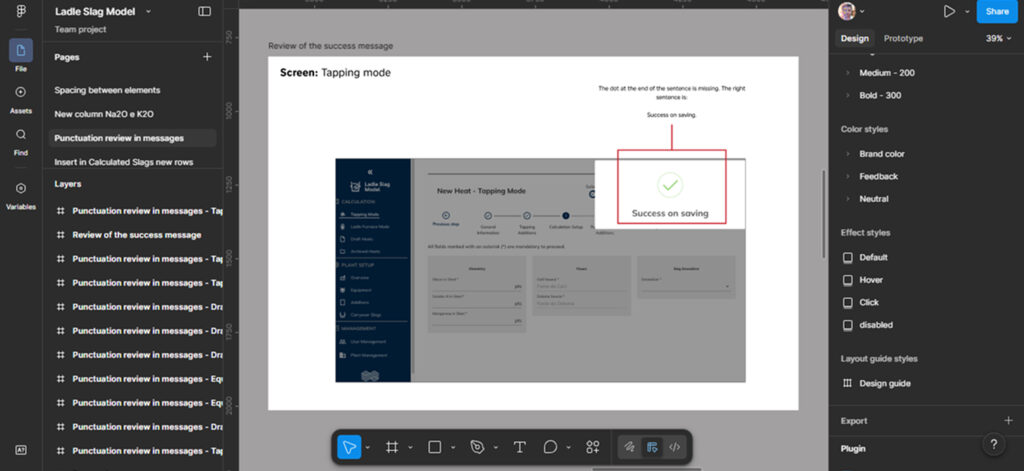
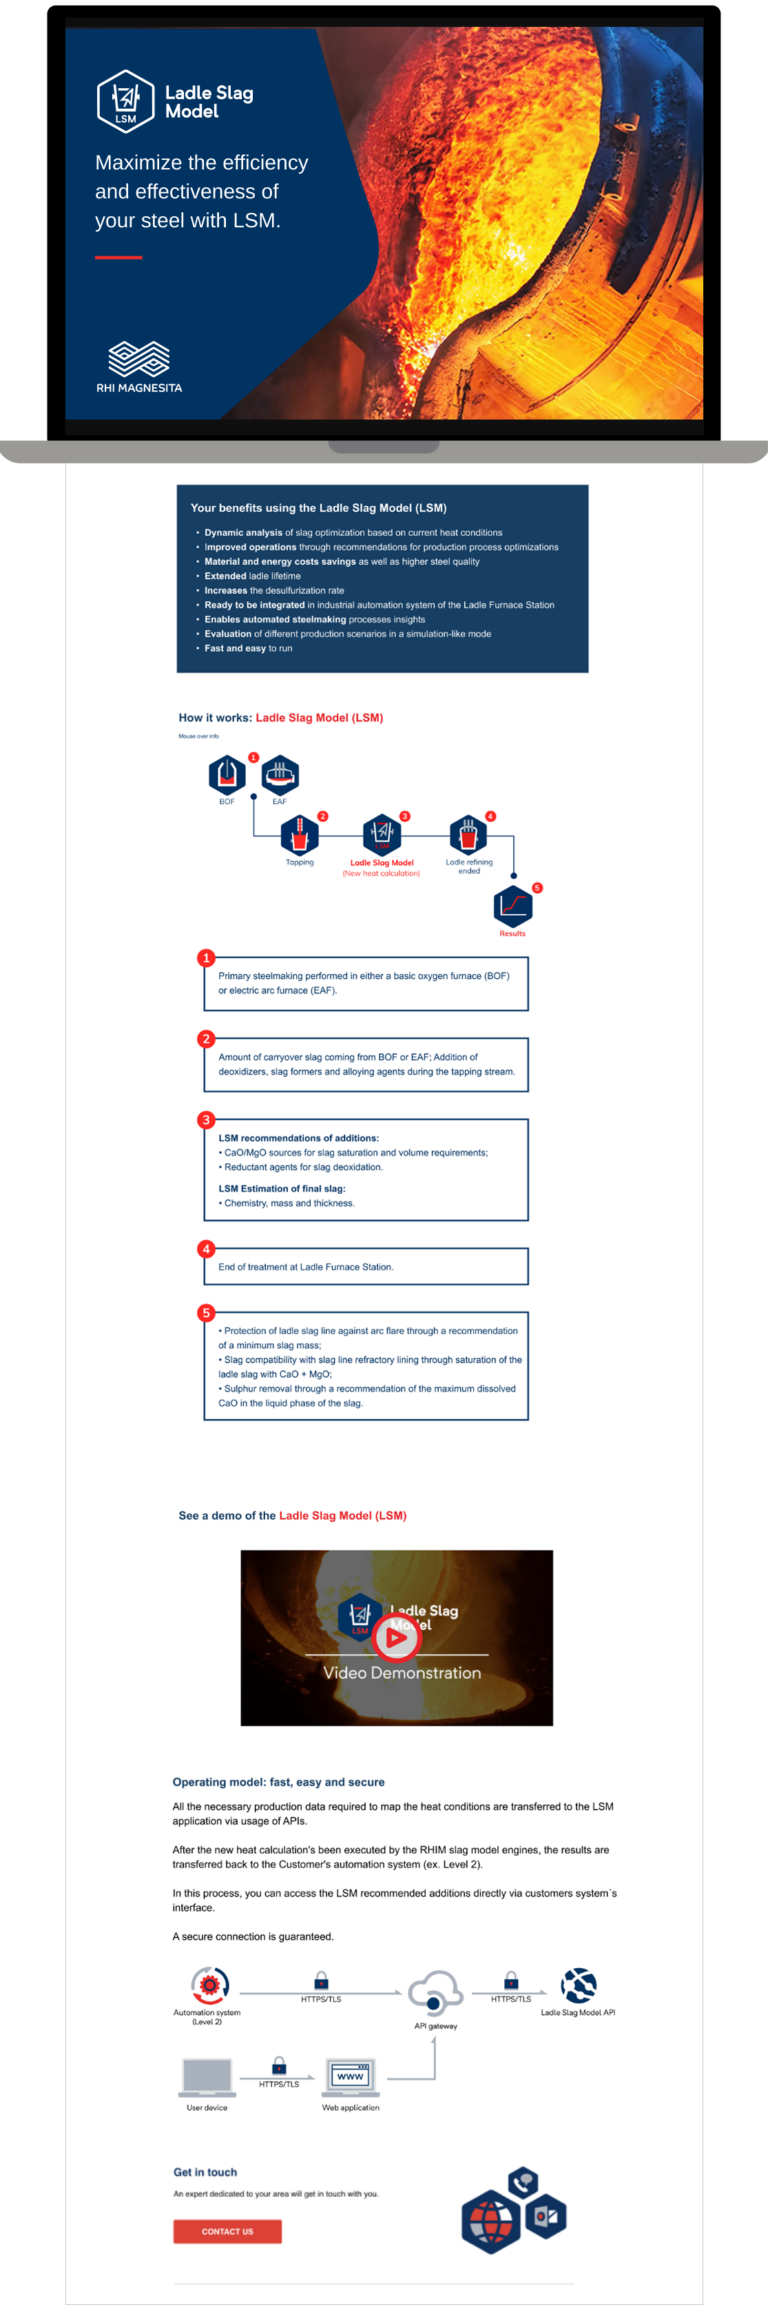
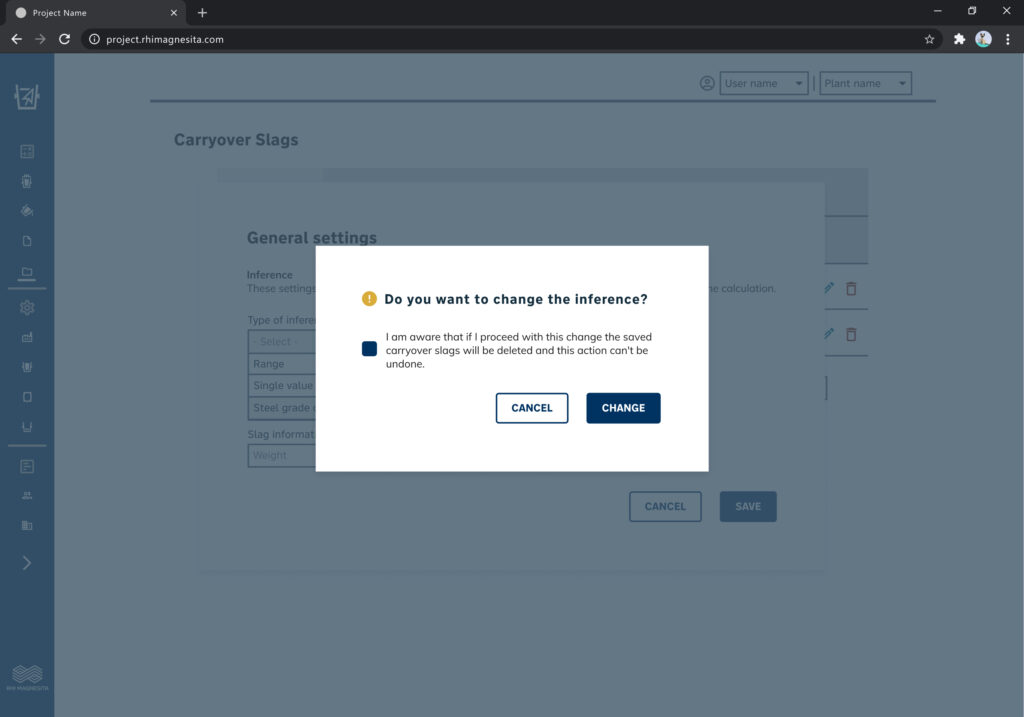
The Ladle Slag Model (LSM) digitizes metallurgical expertise by translating real-time process data into precise chemical adjustment recommendations.
This secure, API-driven workflow optimizes slag saturation across two critical phases: Tapping and Ladle Furnace, ensuring operational efficiency from the automation system directly to the user’s device.
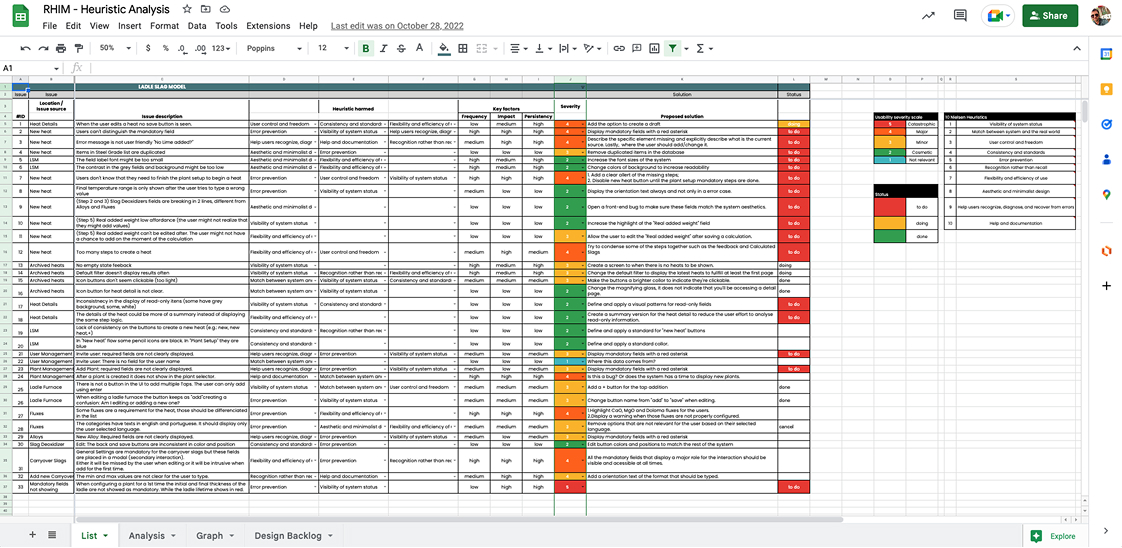
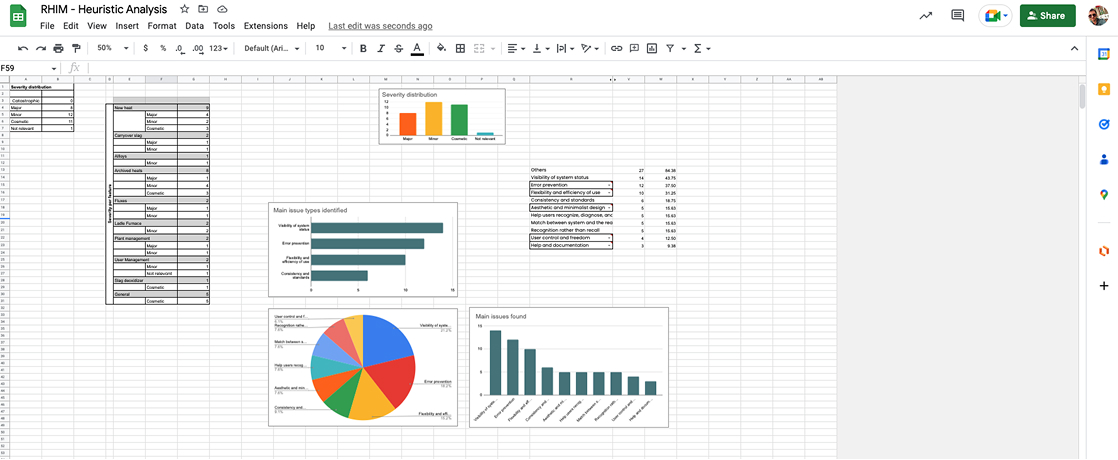
Heuristic analysis
I ran a heuristic analysis to identify and prioritize product improvements, scoring each fix by severity and implementation difficulty. The results were packaged into a clear presentation, enabling streamlined, actionable discussion with stakeholders.
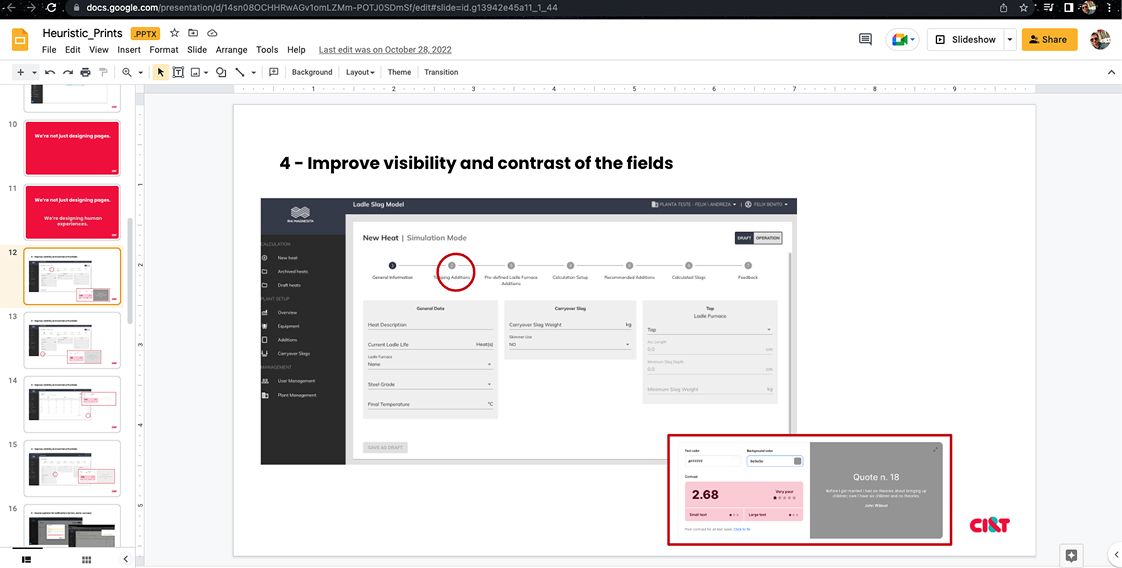
Improvements
Following a heuristic evaluation, I mapped critical usability gaps and translated those insights into a comprehensive design proposal aimed at streamlining the metallurgical workflow.
Problems identified:
Design with old style
Problems of contrast in colors, fonts, spacing and boxes
Product without a specific branding
Boxes that are not necessary
Different design patterns between the pages
Required fields are not flagged
No responsive mode
Old version:
Improvements with the new version:
Modern design
Contrast accordingly with the WCAG guidelines
Branding and a logotype
Clean boxes only when it is necessary
Design system to create a strong pattern in the pages
Required fields are flagged in order to help the user
Responsive mode and collapsed menu
New version:
Design workshops
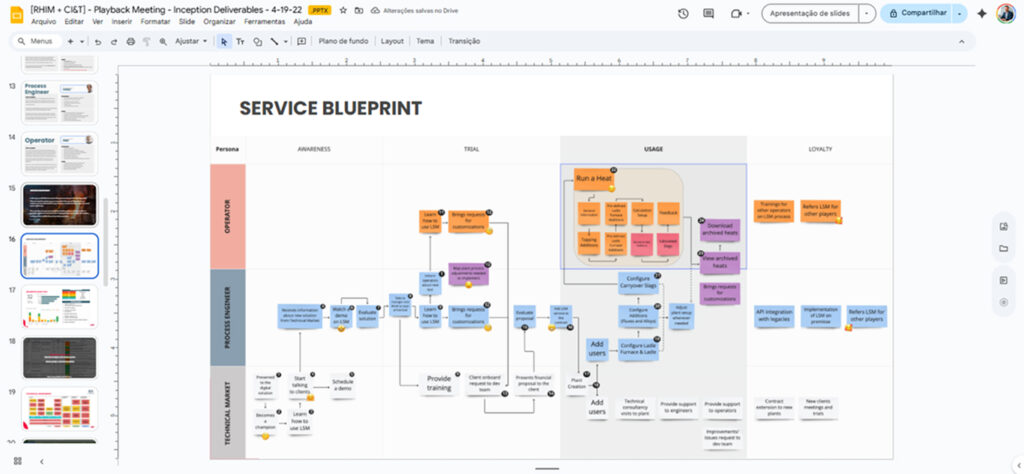
Facilitated collaborative design workshops with cross-functional teams to ideate solutions, map complex user flows, and critique design proposals.
These sessions were instrumental in aligning engineering constraints with user needs, ensuring every screen was rigorously reviewed and validated before development.
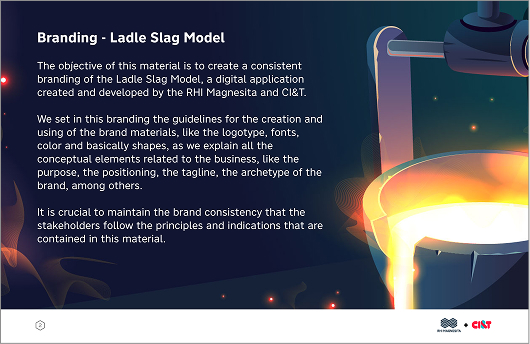
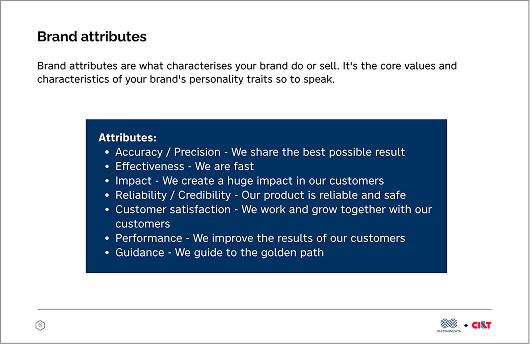
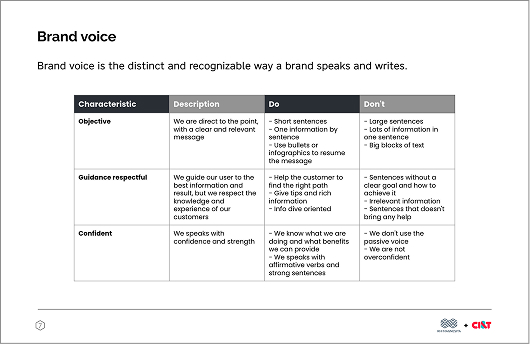
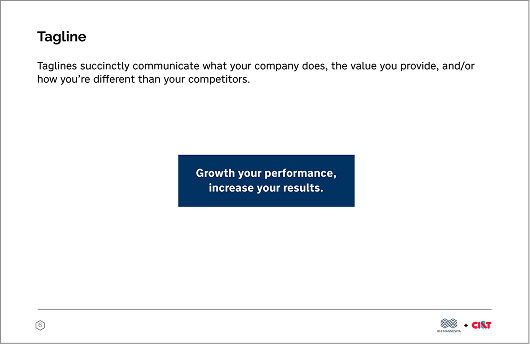
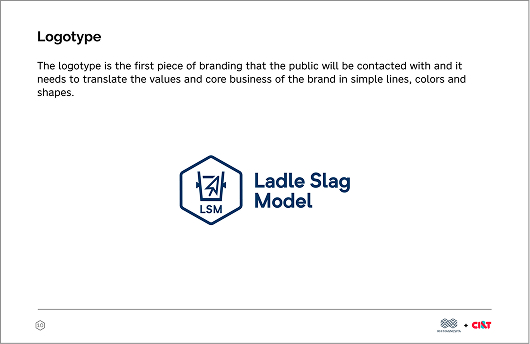
Branding
Testing with engineers revealed that the tool lacked a cohesive identity, relying on generic typography that failed to reflect its technical power. I pivoted to a strategic market approach, developing a robust brand identity rooted in persona research. By aligning the visual language with the business model, I transformed the system from a simple utility into a professional, market-ready product.
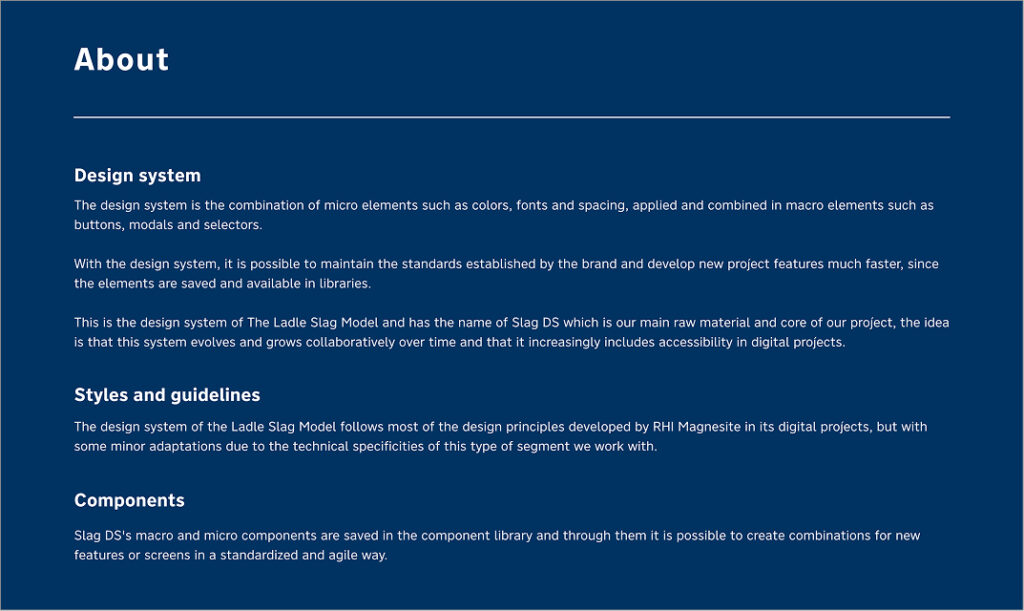
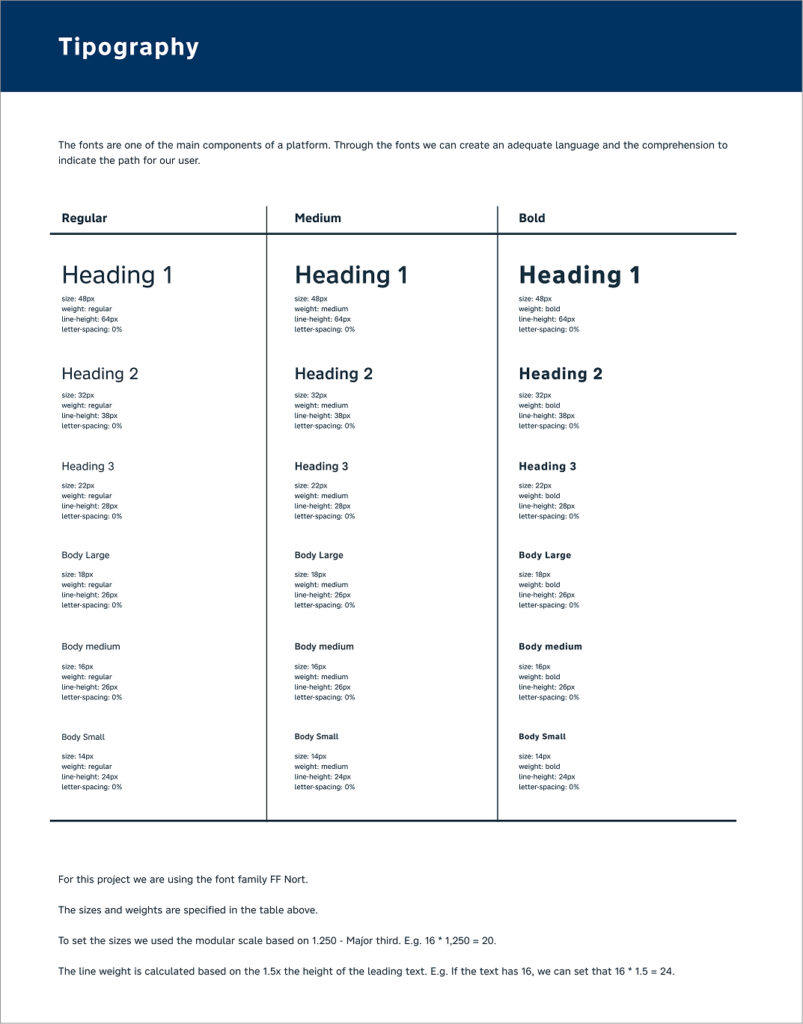
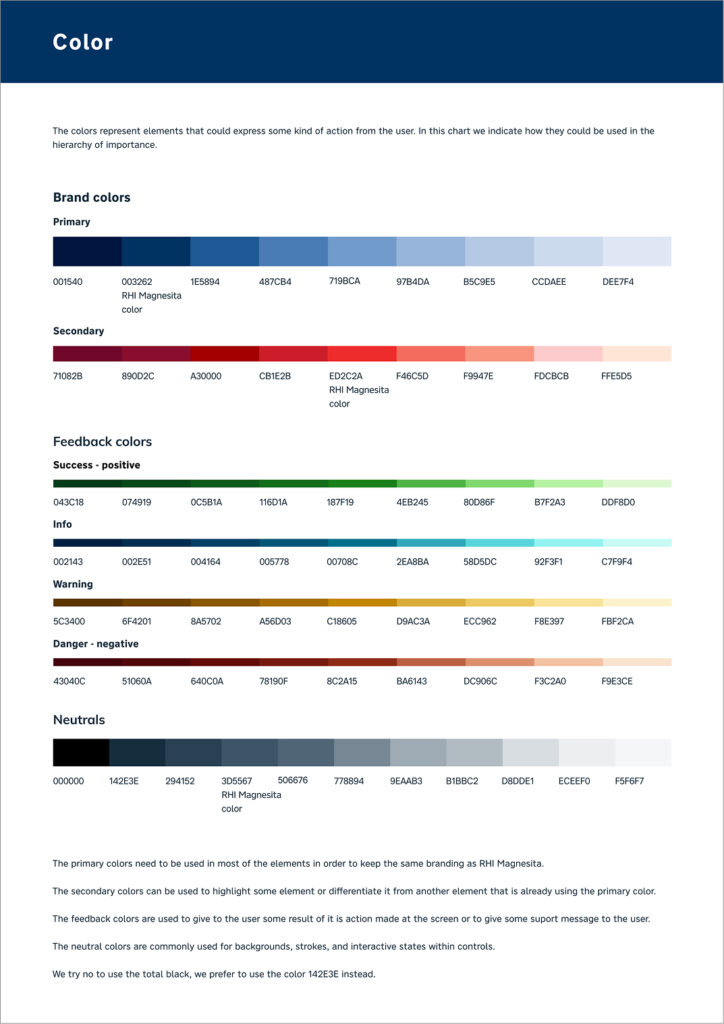
Design system
Following the brand rollout, I architected a comprehensive Design System. By establishing a library of standardized patterns and reusable components, I ensured visual consistency across the platform while significantly accelerating the development cycle for both legacy screens and new feature sets.
Marketing materials
To support the product launch and user adoption, I designed a suite of multichannel marketing assets.
This included high-conversion landing pages, video presentation, strategic email campaigns, and targeted communication materials for WhatsApp, ensuring a consistent brand experience across every customer touchpoint.
Landing page
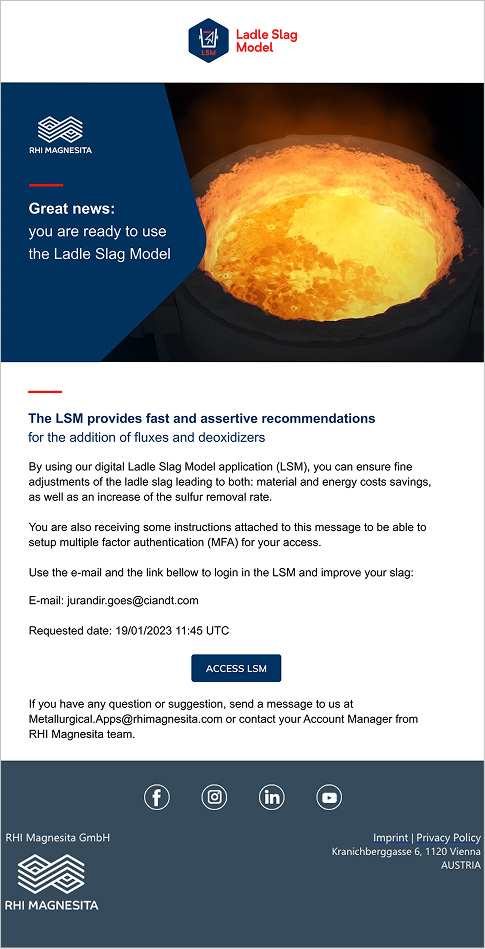
Email marketing
Key Contributions & Impact
Product Redesign & Accessibility: Overhauled the legacy interface to implement a modern visual language, prioritizing WCAG-compliant contrast and accessibility standards while simplifying user flows to reduce cognitive load in high-pressure environments.
Design System Architecture: Developed a comprehensive Branding and Design System from the ground up. This established a unified UI pattern library that significantly accelerated the development of new components and standardized the experience across the entire platform.
On-site Field Research: Conducted in-person plant visits to observe the meltshop environment firsthand. Facilitated and led collaborative design workshops with engineers and operators to bridge the gap between technical constraints and user needs.
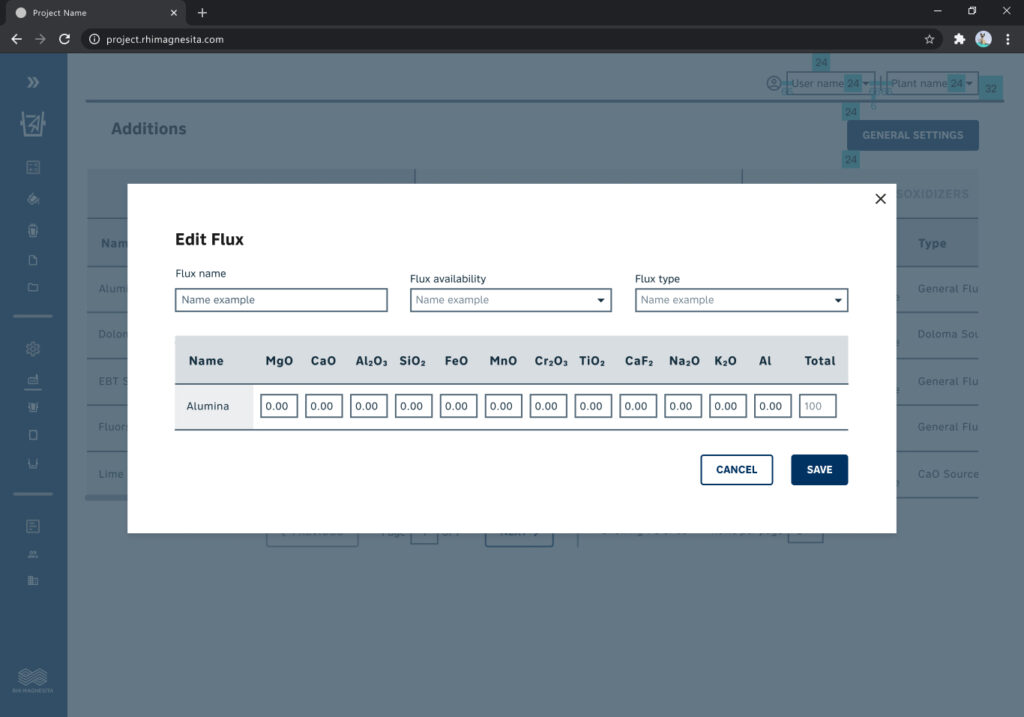
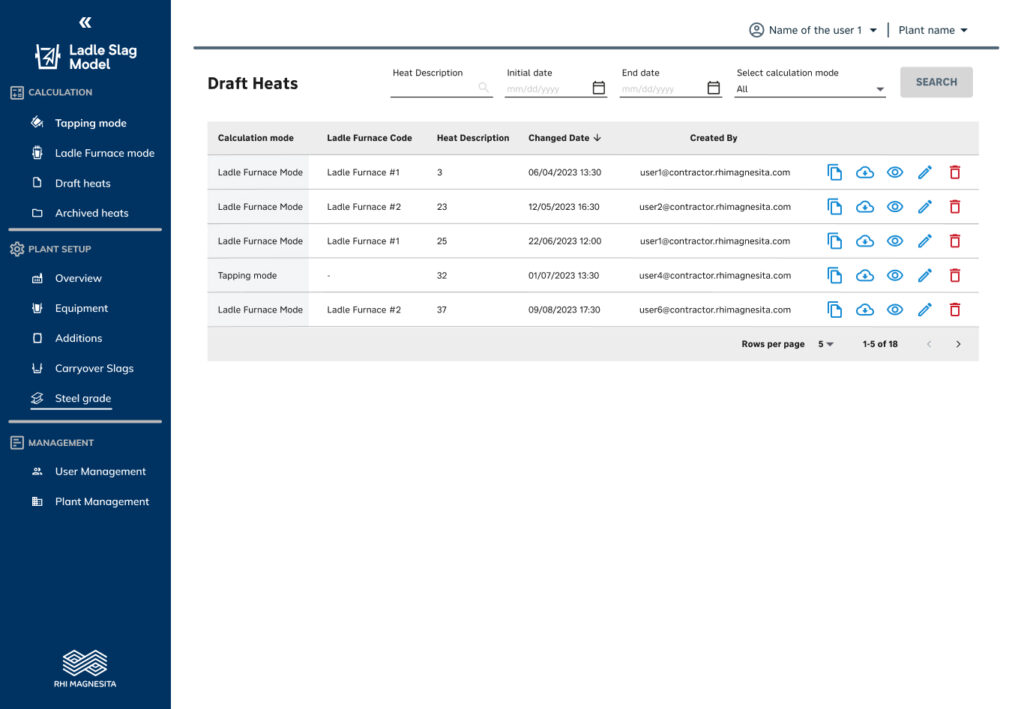
Feature Engineering (17+ Modules): Designed and delivered 17 complex technical features, including Tapping Mode, Steel Grade & Category Management, Plating User Administration, and Draft Editing Restrictions, ensuring each met rigorous engineering requirements: